NOTE: Selections in the Chart Properties will change based on the type of chart, type of report and other parameters.
•As each chart property is selected, the chart updates on the screen.
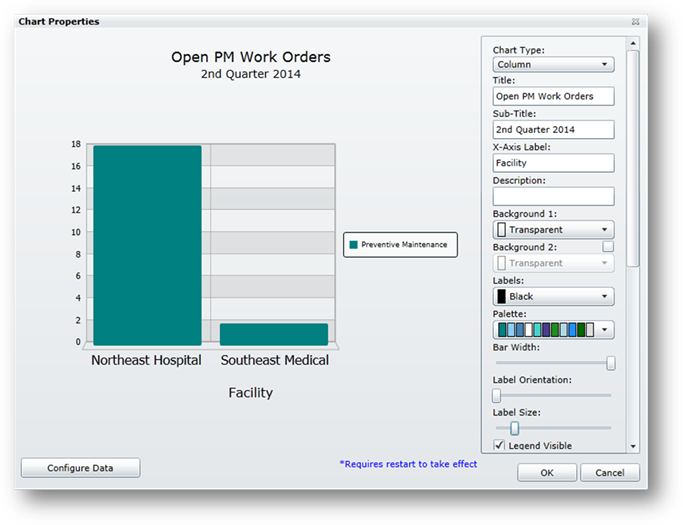
1. Chart Type – Select Column, Line, Point, Pie or Gauge.
2. Title – Enter a title for the chart.
3. Sub-Title – Enter a sub-title for the chart
NOTE: The Y-Axis does not have a label; the sub-title can be used as a descriptor for the numeric value on the Y-Axis.
4. X-Axis Label – Enter a label for the X-Axis.
5. Description – Enter a description for the X-Axis.
6. Background 1 – Select a background color for the chart.
7. Background 2 – To add gradient color to the chart, check the box and select a color.
8. Labels – Select a color for the data point labels.
9. Palette – Select a color group.
10. Bar Width (Column charts only) – Use the slider bar to select the width of the bars in the chart.
11. Label Orientation – Slide the bar to rotate X-Axis labels.
12. Label Size – Slide the bar to select the size of the labels in the chart.
13. Legend Visible – Select to display data point information.
14. Grid Visible – Select to display gridlines.
NOTE: This will not update on screen. You must restart Dashboard for this to take effect.
15. Orientation – Select Vertical or Horizontal.
16. Style – Select from Column, Stacked or Stacked 100 chart styles.
17. Target Line Visible – Check if this chart will display a target value.
18. Days – Check if the target value will be “days”.
19. Target Line Value – Enter the value of the target line.
NOTE: Field is grayed if “Days” is checked.
20. Target Line Configuration – Select a color for the target line.
21. Width – Select a width for the target line.
22. Solid/Dashed – The line defaults to dashed; check the “Solid” box to display the target in a solid line.
23. Refresh Rate – Enter the parameter when you want the chart to refresh. Rate is in minutes only.
24. Refresh Rate Visible – Check to display the refresh rate on the Dashboard.
25. Click OK to add the finished chart to the Dashboard Page.