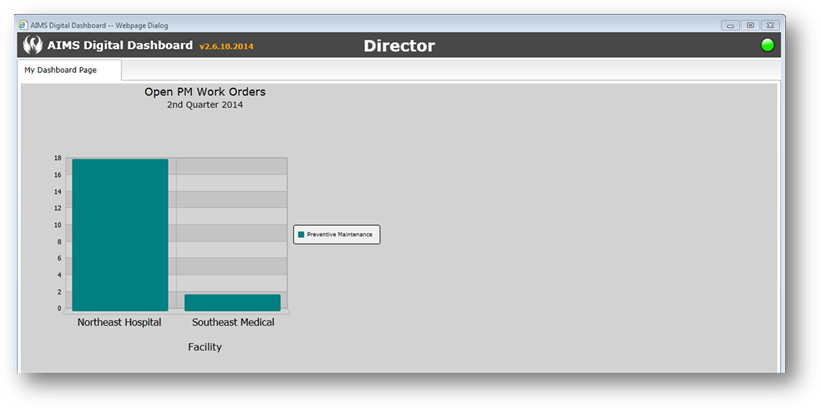
1. Hover the
cursor over a column of the graph to display the exact number of units.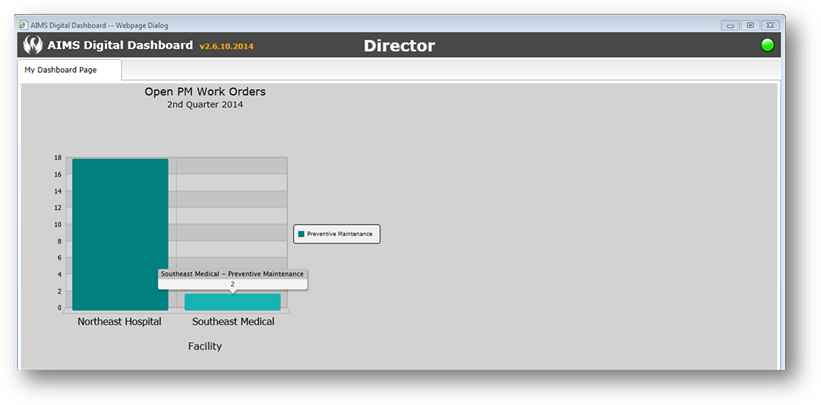
2. With the cursor hovering over the column, right click to display a detailed list of the data.
NOTE: A larger list of data will require a number of seconds to graph or display.
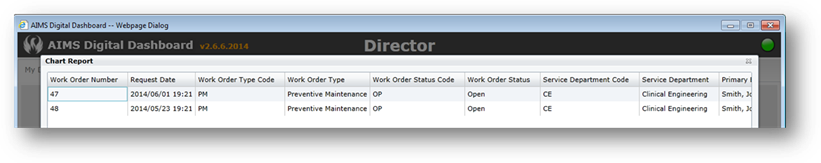
3. Click OK to return to the Digital Dashboard charts.