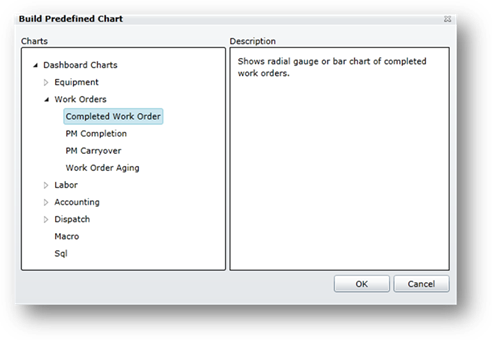
1. Select a predefined chart and click OK.
•The Filter Options screen opens.
2. Select your Filter Options and click OK to save the filter options and view the chart.
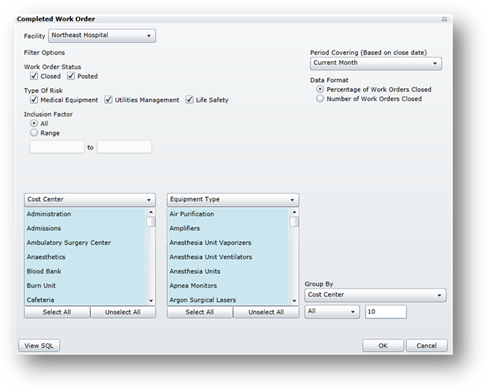
•The preview chart is updated to show your data.
NOTE: Columns will only be created if Data exists for the specified time period.
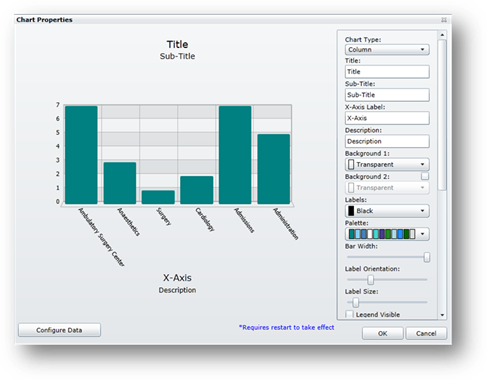
3. See Chart Properties to complete the chart.