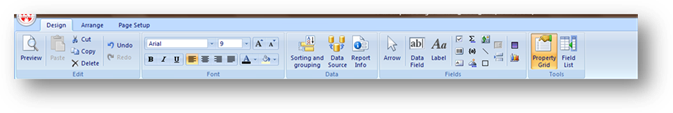
Design Tab
1. Preview: View the report in print preview form.
2. Cut, Copy, Delete, Undo, Redo, Font types and sizes as well as the color objects are normal Windows properties.
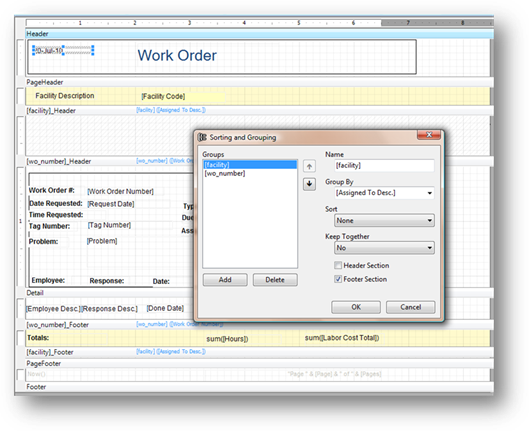
3. Sorting and Grouping: The sort and group function will display a window where field groups and sorts may be added to your report. A group function will batch the records by a field selected and display all the records meeting that group criteria. More than one group may be added to a report.
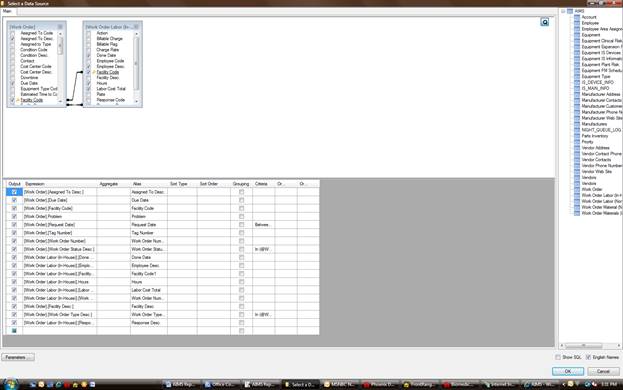
4. Data Source: The Data Source button will take the user to the source location area where tables, fields, parameters and other data functions can be added or removed from the report selections.
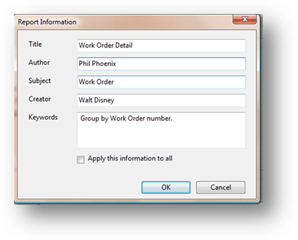
5. Report Info: Optional report authoring entry form.
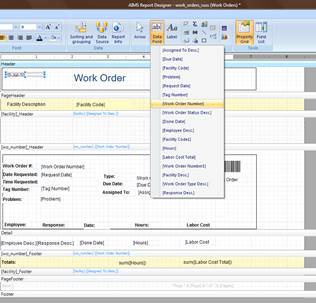
6. Data Fields: A dropdown of fields selected from the data source tab will emerge. The desired field is selected; the cursor arrow will change to a plus (+); hold and move the cursor to the preferred location on the report and release. The field will be placed on the report.
7. Field Labels: By selecting this button your cursor will change to a plus (+). Hold and move the cursor to the preferred location on the report and release. Enter your label.
8. Check Box Icon: Creates a bound field that displays a Boolean value as a check box. By default, the checkbox displays a regular checkmark. You can change it into a radio button or cross mark by changing the value of the field's Checkbox property after it has been created.
9. Barcode field: Places a data field in barcode form. Barcode types available are 39, 93, 128, 2of5, codabar, postnet, ean13, ean8 and upca.
10. RTF field: Creates a Rich Text Field. Select the database field from the dropdown list to be included in your report.
11. Expression field: Creates a calculated field using VB script.
12. Common expression field: Creates a field with a commonly used expression. including the date or time when the report was created or printed, the page number, page count, or "page n of m", or the report name.
13. Unbound Picture field: Creates a field that displays a static picture, such as a logo. A copy will be made of the picture you select and placed in the same directory as the report file.
14. Bound Picture field: Creates a field that displays a picture (or object) stored in the recordset.
15. Line field: Line creation tool.
16. Rectangle field: Rectangle creation tool.
17. Subreport field: Creates a field that displays another report. The field is normally placed in the report footer of your report so when printing both reports will print. Like tables, there should be a common link between reports.
18. Page Break field: Creates a field that inserts a page break.
19. Gradient field: Creates a gradient graph to imbed into your report.
20. Chart field: Creates a chart graph to imbed into your report.
Note: After you click any of these icons, drag the mouse over the report and the cursor will change into a crosshair. Click and drag to define the rectangle that the new field will occupy, and then release the button to create the new field. If you change your mind, hit the ESC key or click the arrow button to cancel the operation.
Arrange Tab
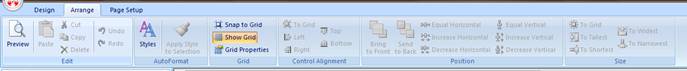
1. Style options: (Appearance templates). You can choose from available style templates or create your own.
2. Snap to Grid: Snap To Grid automatically aligns field objects, text, pictures, and other objects as you place or move them on the page.
3. Show Grid: Show Grid will place a grid on your report and is used to manually align objects to the report.
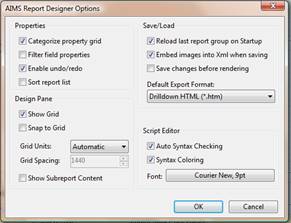
4. Grid Properties: Contains Aims Report Designer Options.
5. Send to Back: Send to Back will move the selected object behind all other objects in the same icon.
6. Bring to Front: Bring to Front will move the selected object in front of all other objects in the same icon.
Page Setup
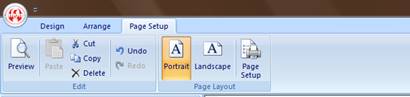
Standard report and print layout options.