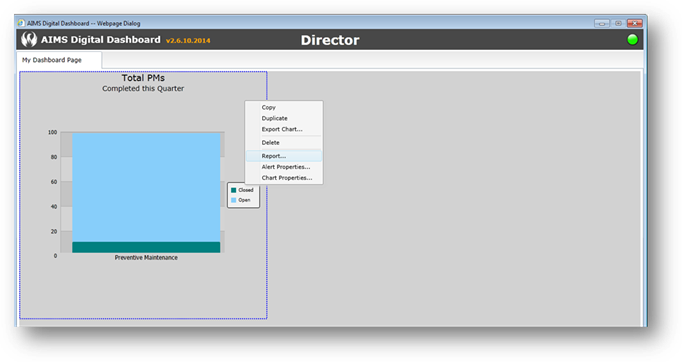
1. Click on the Chart Title to display the Chart border.
2. Right click in an open area inside of the border.
3. Select Report.
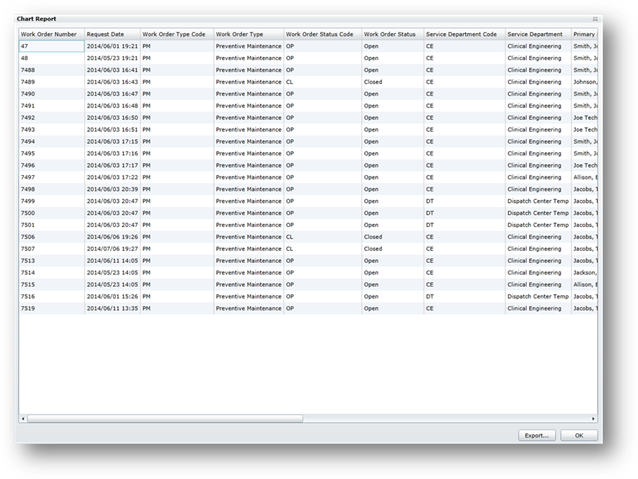
• The dialog opens to display the Chart as a report.