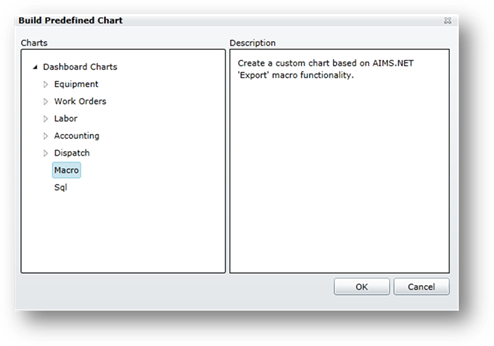
1. Select Macro and click OK to create a custom chart from a saved Macro.
•The Chart Builder screen opens.
•A Column Chart will be used as an example.
NOTE: Selections in the Chart Builder will change based on the type of chart, type of report and other parameters.
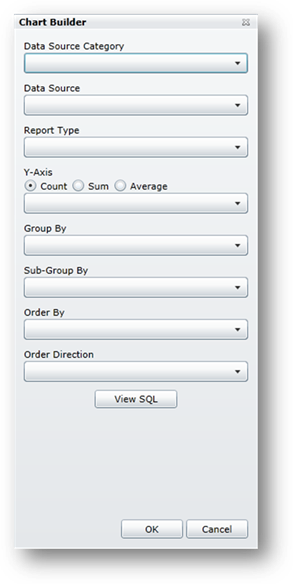
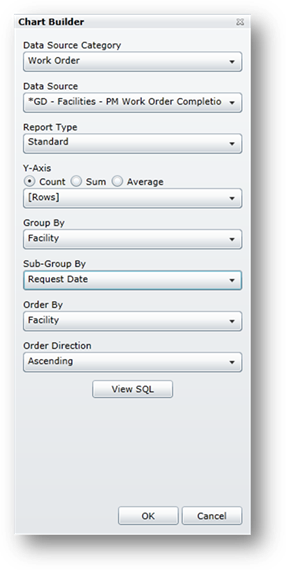
2. Data Source Category – Select Work Orders, Equipment or Contracts.
3. Data Source – Select your saved macro.
4. Report Type – The previously selected Data Source must meet report requirements to be active for selection. Applicable reports will display in bold text.
5. Y-Axis
Count/Sum/Average – Select the display for the Y-Axis.
Drop-Down – Displays what the count, sum or average is “by”, i.e. row.
6. Group By – Information in the X-Axis will be grouped by the selection.
7. Sub-Group By – Information will be sub-grouped by the selection.
8. Order By – Selections include the Y-Axis selection or the Group By selection.
9. Order Direction – Select Ascending or Descending.
10. Click OK to save the Chart Builder options and view the completed chart.
•The preview chart is updated to show your data.
NOTE: Columns will only be created if Data exists for the specified time period.
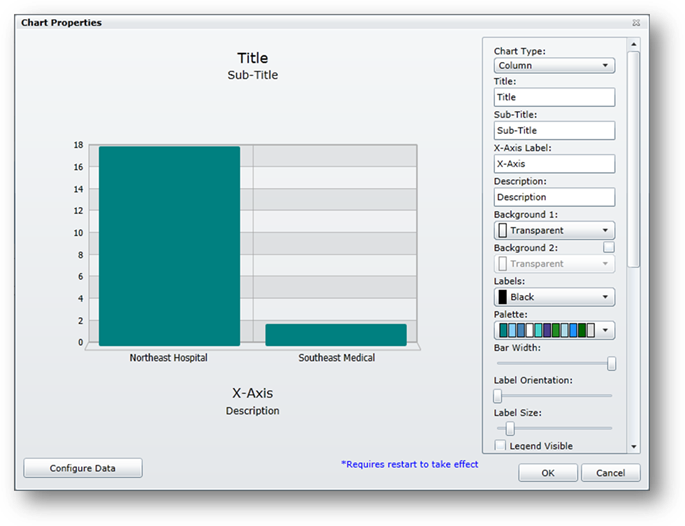
11. See Chart Properties to complete the chart.